
“A dataset doesn't tell you a story. You have to find the story hidden inside it.”
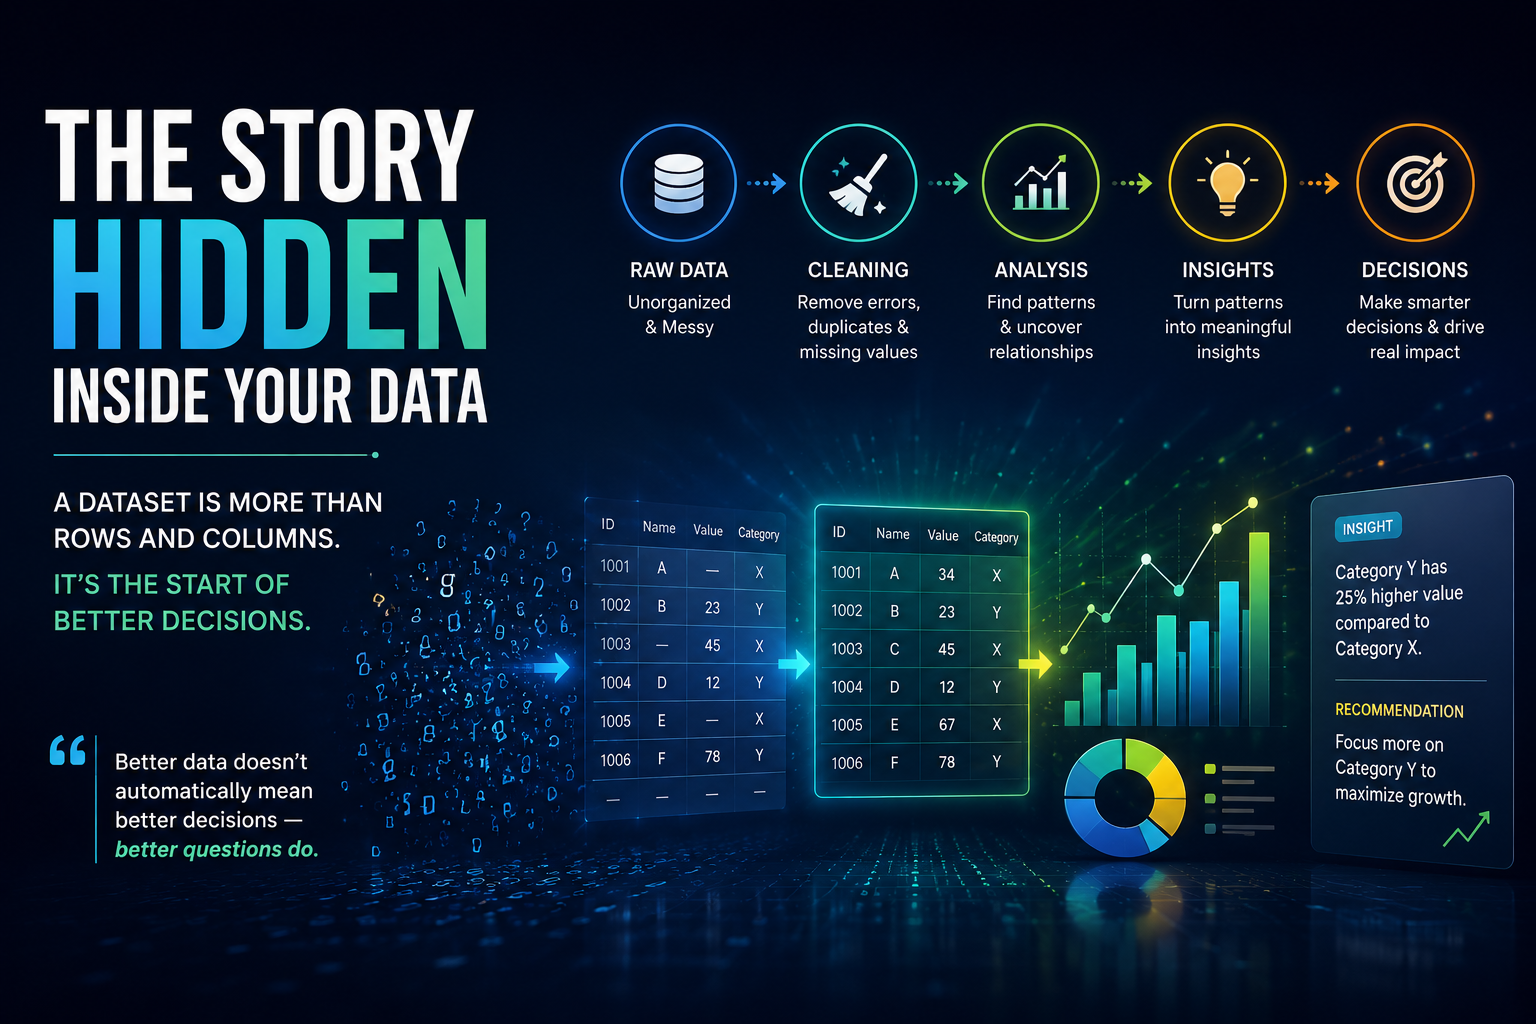
When most people hear the word dataset, the image that springs to mind is a spreadsheet: endless rows and columns of numbers or text, stretching off into digital infinity. But a dataset is much more than just a table—it’s the raw material from which meaningful insights, business strategies, and even scientific discoveries are forged. The magic happens not in the data itself, but in the transformation from raw information to actionable knowledge.
What Exactly Is a Dataset?
At its core, a dataset is simply a collection of data points, often organized in a structured format such as a table. Each row in the table might represent an individual, a transaction, or a moment in time, while each column stands for a specific variable or feature—like age, price, or location. But datasets can also be more complex, including collections of images, audio recordings, or free-form text.
- Rows: Individual records (e.g., a customer, a product, a sale).
- Columns: Attributes or features (e.g., name, date, amount).
- Cells: The intersection of a row and column, holding a single data value.
But not all data fits neatly into this tabular mold. That brings us to the next important distinction.
Structured vs. Unstructured Data
Data comes in many forms, but it is often classified into two broad types:
Structured Data
This is data that fits into a predefined model or format—think spreadsheets, databases, and CSV files. Structured data is easy to organize, search, and analyze. Each piece of information has its own place, making it ideal for quantitative analysis.
Unstructured Data
Unstructured data, on the other hand, lacks a defined structure. Examples include emails, social media posts, images, videos, and audio files. Extracting meaning from unstructured data requires more advanced techniques such as natural language processing or image recognition.
Most real-world datasets are a mix of both, and transforming unstructured data into something analyzable is often the first challenge.
Why Raw Datasets Are Often Messy
Rarely does data arrive on your digital doorstep in perfect order. Raw datasets are frequently plagued with problems:
- Missing values: Gaps where information hasn’t been recorded.
- Duplicates: The same record appearing multiple times.
- Inconsistencies: Mismatched formats, misspellings, or conflicting data.
- Outliers: Values that fall far outside the expected range.
This messiness is not just a nuisance—it can seriously skew your analysis and lead to faulty conclusions. That’s why the next step is so critical.
Data Cleaning: Turning Chaos into Order
Data cleaning, sometimes called data wrangling or preprocessing, is the process of correcting or removing errors and inconsistencies in your dataset. It’s often said that 80% of data analysis is cleaning the data, and with good reason: clean data is the foundation of trustworthy insights.
Key Steps in Data Cleaning
- Identify and handle missing values—decide whether to fill them in, remove them, or leave them as is.
- Remove duplicates—ensure each record is unique.
- Standardize formats—make sure dates, numbers, and text are consistent throughout.
- Correct errors—fix misspellings, mismatched codes, or obvious mistakes.
- Handle outliers—decide if unusual values are errors or important signals.
Only after these steps can you trust the data to reveal its secrets.
Finding Patterns and Relationships
With a clean dataset in hand, the real exploration begins. Analysts and data scientists use statistical tools and algorithms to uncover patterns, correlations, and trends. For example:
- Are certain products frequently bought together?
- Does customer age correlate with purchase frequency?
- Are there seasonal trends in sales?
Finding these relationships is the first step to turning data into insight. Sometimes, the patterns are obvious; other times, they require creative thinking and the right questions.
How Visualization Turns Numbers into Insights
Even the cleanest, most organized dataset can be overwhelming in raw form. Visualization tools—like charts, graphs, and heatmaps—help make sense of the numbers. A well-chosen visualization can reveal trends and outliers at a glance, making complex data accessible to everyone, not just analysts.
- Bar charts show comparisons between groups.
- Line graphs highlight trends over time.
- Scatter plots reveal correlations between variables.
- Heatmaps provide a color-coded overview of patterns.
Visualizations turn data from a wall of numbers into a story you can see and understand.
Real-World Example: E-Commerce Customer Dataset
Imagine an online store collects data on its customers and their purchases. The raw dataset might include:
- Customer ID
- Name and contact information
- Purchase dates and amounts
- Product categories
- Payment methods
At first glance, it's just a spreadsheet. But after cleaning the data—removing duplicates, handling missing values, and standardizing formats—you can begin to ask meaningful questions:
- Who are the most valuable customers?
- Which products are most frequently bought together?
- Are certain times of year more profitable than others?
Creating a visualization of monthly sales, for example, might reveal unexpected seasonal spikes. Segmenting customers by purchase frequency could help identify targets for loyalty programs. Suddenly, the dataset is telling a story about your business and your customers.
How Businesses Use Datasets to Make Decisions
Organizations of all sizes rely on datasets to inform their strategies. Clean, well-analyzed data can help businesses:
- Improve marketing campaigns by targeting the right customers.
- Optimize inventory by predicting demand trends.
- Enhance customer experience by identifying pain points and preferences.
- Increase profitability by streamlining operations based on real data.
But it’s important to remember: the value of a dataset isn’t just in the data itself, but in the questions you ask of it.
The Key Takeaway: Better Data Needs Better Questions
It’s tempting to believe that more data automatically leads to better decisions. In reality, a dataset—no matter how vast or well-organized—is only as useful as the questions you pose. The journey from raw data to actionable insight requires curiosity, creativity, and a willingness to dig beneath the surface.
The next time you open a spreadsheet, remember: you’re not just looking at data. You’re looking at the potential for discovery, innovation, and smart decision-making—if you’re willing to find the story hidden inside.